
Background
The business school, based in mainland Europe, is an elite business school which was ranked in the top three schools worldwide in its field.
The flagship programme was a Master’s programme which attracted academically elite students from around the world. Graduates from the school were generally highly sought after and were easily placed into excellent jobs within largely blue-chip businesses.
Like a lot of business schools, they had observed that within each semester intake (3 semesters per year) there was a significant and worrying dropout rate. 30% of students either
- fail to complete the programme
- drop out to return at a later date or
- changed course to a lower-level programme
This has a number of actual and potential implications for the institution and the students.
For the Business School, there was the prospect of a loss of income, together with a reputational risk. It’s one thing to be demanding; it can be another to show that you are caring.
Equally concerning was student welfare and student satisfaction. Dropouts were a shared failure. Dropping down to a lesser programme rarely satisfied the affected student and could affect morale.
In fact, the school had an excellent pastoral care process with staff committed to attending to the welfare of students, including a professional psychologist. However, this service was a passive service and relied upon the students alerting staff to any issues at hand. Some students who were distressed or particularly unhappy were not approaching the pastoral care service.
One thing about which the school was fairly adamant was that their students were the elite and should generally be up to the challenge of the demanding course.
The Study
Then the organisation became aware of the Mental Toughness model and the associated measure – MTQ48. It was decided to test an entire spring semester intake – around 125 people.
The objective was simply to see whether the data provided any indication which might help to explain what was happening.
The students were new to the term (about 10 days) and completed the questionnaire in one supervised sitting. They used the online version, and everyone completed it in English, the teaching language of the school. Most students weren’t native English speakers, but all had English as a working language.
The results were fascinating.
The Results
The students were the elite in one sense. Their academic record to this point in their lives was excellent. However, the Mental Toughness scores were not significantly different to those of the normal population. Given that this was a pressured environment, this suggested that a significant proportion (around 30%) would find the course tough – maybe too tough.
What emerged was a fascinating set of results. Before examining these, it is worth setting out some benchmark information.
Generally, Psychometric data such as MTQ48 is analysed by reference to the normal distribution curve. Most qualities and traits of this type are distributed normally in nature. We expect, therefore, to find that the population is distributed as follows:
| STEN | |||||||||
| 1 | 2 | 3 | 4 | 5 | 6 | 7 | 8 | 9 | 10 |
| PERCENTILE | |||||||||
| 2.5% | 4.5% | 9% | 15% | 19% | 19% | 15% | 9% | 4.5% | 2.5% |
Stens 1 – 3 typically represent “low” scores – they tend show evidence of Mental Sensitivity
Stens 8 – 10 typically represent “high” scores – they tend to show evidence of Mental Toughness
Stens 4 -7 typically represent the typical or average or normal person. This covers 68% of the population and these will be balanced between Mental Toughness and Mental Sensitivity.
If we are looking at different populations we will expect to see slightly different norms. For attendees on a demanding elite programme we might expect something slightly higher than the norm.
Implications for each MT construct:
Control – How will they deal with a varied and complex workload? Will they have a sense of self worth to be able to rise to the challenge? Can they manage their emotions?
Challenge – How will they deal with a new environment and with new experiences? Will they learn from want happens to them? The Masters programme is one big challenge.
Commitment – How will deal with working to clear and demanding goals in a very short time scale? Dealing with a number of closely targeted events could be an issue
Confidence – How will they deal with setbacks and major problems? Will they be able toi engage with others for support and fir help when needed?
The study showed the following:
Assessment of Mental Toughness
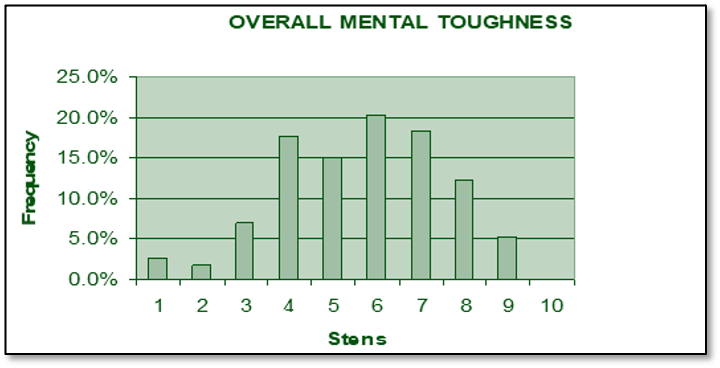
The Overall Mental Toughness profile was significantly lower than expected. The distribution of scores was not significantly different from a normal distribution.
These might be academically elite, they are as sensitive as most people on the whole. More than 30% had scores of sten 4 or lower
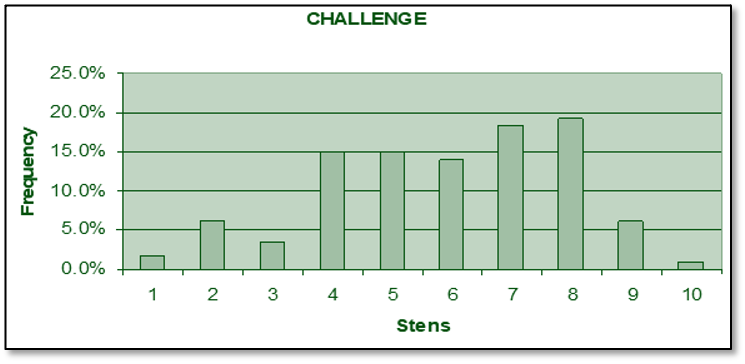
When the Challenge scale was examined this too had a profile which was lower than expected. Most students had scores which were typical of the average person. Only a small proportion had scores which suggested they would respond well to challenge, change and variety.
Again, a significant number had low scores.
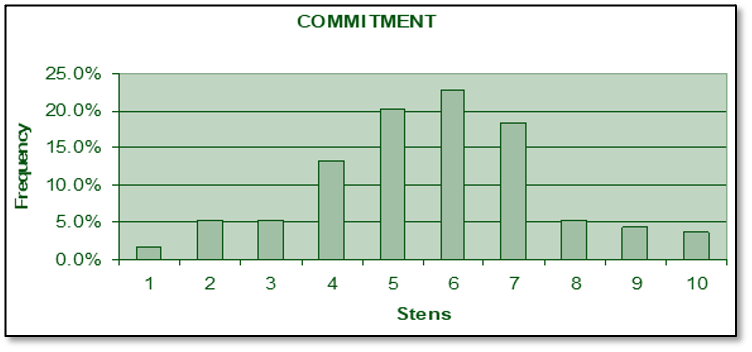
Examining responses to the Commitment scale also showed that the majority of students (70%) had scores which were no different to average scores in the general population. Only a small proportion had high scores for commitment.
This is particularly significant because the essence of a Master’s programme is the focus on achieving a very specific, measurable goal in a finite time scale.
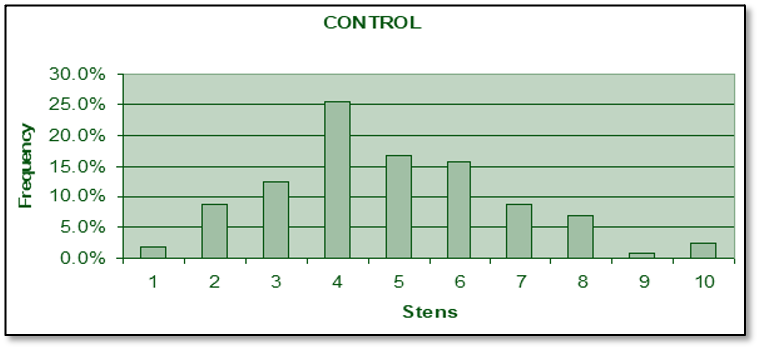
Analysis of the scores for Control showed that the curve was skewed to the left. This is perhaps the most interesting aspect of the pattern of scores.
One implication of control is that it determines to what extent the individual believes they can deal with a multiplicity of tasks and will plan to deal with those effectively.
Being given a variety of tasks and activities and being expected to prioritise and deal with these in fairly short time frames will create problems for most of this population.
If the students had arrived at this school from establishments which “spoon-fed” education, then the students may not have developed this capability to multitask.
What Seligman calls “learned helplessness”.
Finally, examining scores for Confidence was also revealing. Less than 25% of students had high scores on the confidence scale. Confidence can be considered a driver for Mental Toughness – it reflects the individual’s ability to deal with setbacks and remain optimistic in the face of difficulty.
The Master’s programme was certainly tough and challenging, and had lots of scope for setbacks. A surprisingly large proportion of students had low scores (stens 1 – 3). If people have been exposed to long periods of pressure, stress and challenge, they can get worn down and their Confidence suffers.
Outcomes
- There was a strong correlation between Mental Toughness profiles and student drop-out rates.
- Mental Toughness is developable in most individuals, and targeted interventions should lead to improved Mental Toughness and lower dropout rates.
- Pastoral care could and should be more proactive. Screening each intake would identify people most at risk. Interventions should be directed towards them. This does not require additional resources. It uses existing resources more effectively.
- Supporting students better should lead to higher student satisfaction scores. Something that has been borne out in other studies.